Customer is India’s largest provider of integrated payments technology, with leading enterprise brands as partners in changing the face of payments. Using technology, they provide smooth and secure payment solutions that help businesses optimize transactions and enhance customer experiences across multiple industries
The customer was facing challenges in managing and analyzing DevOps data across multiple tools due to on-premise infrastructure constraints. Because there wasn’t any single view into integrated data, it became tough to trace key metrics accurately, hence fragmenting insights and increasing manual efforts in data collection. Also due to this, frequent errors and inconsistencies have been noticed in reports, which is affecting the focus of engineering teams on continuous improvement.
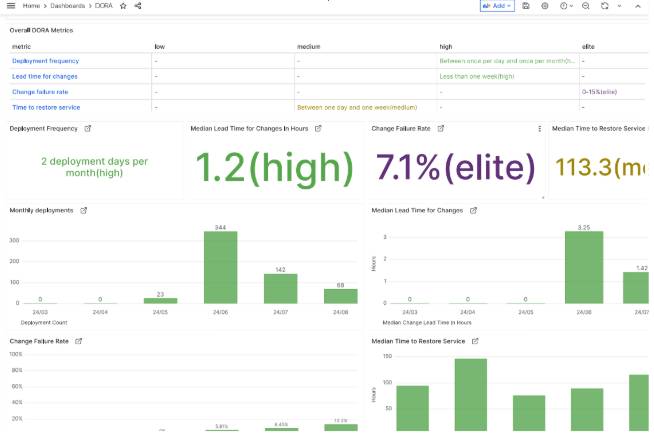
DevLake aligned very well with client business needs at the time, pushing forward the monitoring and analysis capabilities for the company in relation to DevOps. Such integration not only united data across several tools, it also made the tracing of key metrics easier, reduced manual data collection, and minimized errors. Devlake was much more efficient and insightful, allowing engineering teams to focus on continuous improvement rather than operational overhead leading to a 60% increase in deployment frequencies. Also, DORA metrics played an important role in tracing bottlenecks, increasing the reliability of their CI/CD pipelines, fastening delivery cycles, and increasing time-to-market by 40%.
The diagram below explains the data flow from different DevOps tools:
Config UI: Help us to create Data Connections with tools like GitHub, GitLab, Jira, etc., API Server: It will connect to Runner and Database to interact across the machine.
Database: It stores the UserData and Pipeline Data connected by Data Connections in Blueprints.
Runner: Execute the logic defined in ConfigUI and deliver it to Plugins and Database.
Plugins: Helps DevLake to connect with DevOps tools like GitHub and GitLab to get data.
Dashboard: Important place to make decisions, It helps us to visualize the collected data and make the desired metrics visualize in DevOps Ecosystem

Combined metrics offer a complete performance overview:


Metrics gathered from Jenkins source code:

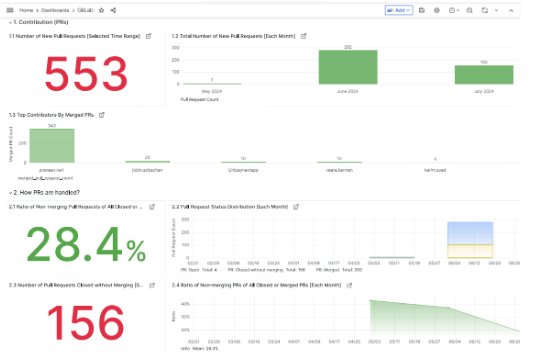
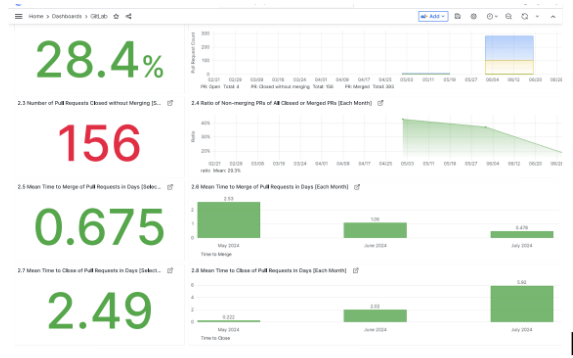
Metrics obtained from GitLab repository data


Metrics sourced from SonarQube analysis:

Metrics derived from Jira project management:

Metrics extracted from DORA dashboard insights:

CloudifyOps Pvt Ltd, Ground Floor, Block C, DSR Techno Cube, Survey No.68, Varthur Rd, Thubarahalli, Bengaluru, Karnataka 560066
CloudifyOps Pvt Ltd, Cove Offices OMR, 10th Floor, Prince Infocity 1, Old Mahabalipuram Road, 50,1st Street, Kandhanchavadi, Perungudi, Chennai, Tamil Nadu - 600096
CloudifyOps Inc.,
200, Continental Dr Suite 401,
Newark, Delaware 19713,
United States of America
Copyright 2025 CloudifyOps. All Rights Reserved
